Dan Green
Homebuyer.com
Dan Green (NMLS 227607) is a licensed mortgage professional who has helped millions of people achieve their American Dream of homeownership. Dan has developed dozens of tools, written thousands of mortgage articles, and recorded hundreds of educational videos. Read more about Dan Green.

This website discusses mortgage programs and how to qualify. Your eligibility may vary based on lender guidelines and investor overlays. Check with your lender for specific details.
Trusted Content
This article was checked for accuracy as of December 12, 2024. Learn more about our commitments to accuracy and your mortgage education in our editorial guidelines.
Updated: December 12, 2024
If you want to buy a home in your twenties or thirties, or buy a home out of state, this study of the Best Cities for Young Adults will help you find your next home.
Using data from more than 70 public resources, we ranked the best places to buy a home and applied mathematics fairly. We over-weighted cities that allow you to keep a larger percentage of your paycheck and gave extra consideration to cities with good transportation infrastructure.
We omitted subjective factors completely. You’ll find no mention of a town’s trendiness or hipness.
What are the best cities for young professionals? Where should young adults move after graduation? Use this list to get started.
Check your eligibility and begin your application now.


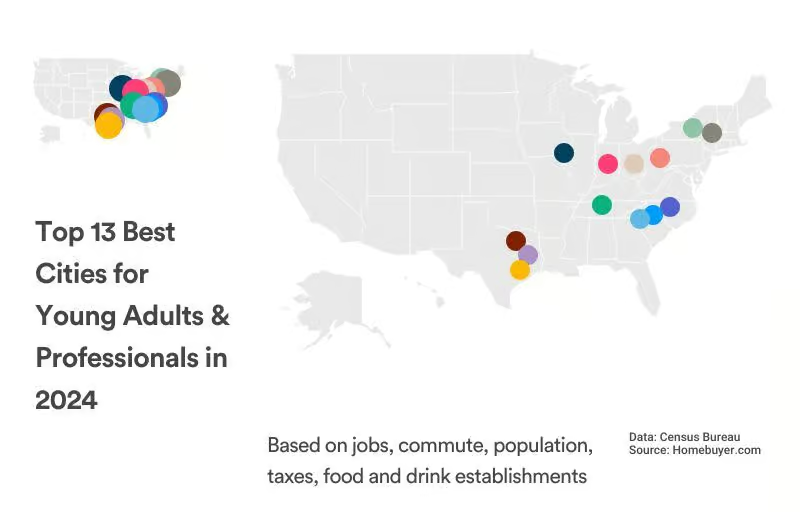
Based on jobs, commute, population, taxes, food and drink establishments
| Overall Rank | City, State | Earned Grade | Region | Regional Rank |
| 1 | Durham, NC | A | South | 1 |
| 2 | Pittsburgh, PA | A | Northeast | 1 |
| 3 | Nashville, TN | A | South | 2 |
| 4 | Des Moines, IA | A | Midwest | 1 |
| 5 | Charlotte, NC | A | South | 3 |
| 6 | Syracuse, NY | A | Northeast | 2 |
| 7 | Columbus, OH | A | Midwest | 2 |
| 8 | Austin, TX | A | South | 4 |
| 9 | Greenville, SC | A | South | 5 |
| 10 | Houston, TX | A | South | 6 |
| 11 | Albany, NY | A | Northeast | 3 |
| 12 | Dallas, TX | A | South | 7 |
| 13 | Indianapolis, IN | A | Midwest | 3 |
| 14 | Harrisburg, PA | A- | Northeast | 4 |
| 15 | Fayetteville, AR | A- | South | 8 |
| 16 | Cincinnati, OH | A- | Midwest | 4 |
| 17 | St. Louis, MO | A- | Midwest | 5 |
| 18 | Lubbock, TX | A- | South | 9 |
| 19 | Gainesville, FL | A- | South | 10 |
| 20 | Omaha, NE | A- | Midwest | 6 |
| 21 | Corpus Christi, TX | A- | South | 11 |
| 22 | Raleigh, NC | A- | South | 12 |
| 23 | Dayton, OH | B+ | Midwest | 7 |
| 24 | Lexington, KY | B+ | South | 13 |
| 25 | Knoxville, TN | B+ | South | 14 |
| 26 | Colorado Springs, CO | B+ | West | 1 |
| 27 | New Haven, CT | B+ | Northeast | 5 |
| 28 | Buffalo, NY | B+ | Northeast | 6 |
| 29 | Rochester, NY | B+ | Northeast | 7 |
| 30 | Seattle, WA | B+ | West | 2 |
| 31 | Birmingham, AL | B+ | South | 15 |
| 32 | Tulsa, OK | B+ | South | 16 |
| 33 | Akron, OH | B+ | Midwest | 8 |
| 34 | Hartford, CT | B+ | Northeast | 8 |
| 35 | Baton Rouge, LA | B+ | South | 17 |
| 36 | Denver, CO | B | West | 3 |
| 37 | Lafayette, LA | B | South | 18 |
| 38 | Boston, MA | B | Northeast | 9 |
| 39 | Louisville, KY | B | South | 19 |
| 40 | Anchorage, AK | B | West | 4 |
| 41 | Boise, ID | B | West | 5 |
| 42 | Jacksonville, FL | B | South | 20 |
| 43 | Grand Rapids, MI | B | Midwest | 9 |
| 44 | Spokane, WA | B- | West | 6 |
| 45 | Savannah, GA | B- | South | 21 |
| 46 | Winston-Salem, NC | B- | South | 22 |
| 47 | Memphis, TN | B- | South | 23 |
| 48 | Wichita, KS | B- | Midwest | 10 |
| 49 | Baltimore, MD | B- | South | 24 |
| 50 | Kansas City, MO | B- | Midwest | 11 |
| 51 | Washington, DC | B- | South | 25 |
| 52 | Minneapolis, MN | B- | Midwest | 12 |
| 53 | Chattanooga, TN | C+ | South | 26 |
| 54 | Oklahoma City, OK | C+ | South | 27 |
| 55 | Cleveland, OH | C+ | Midwest | 13 |
| 56 | Milwaukee, WI | C+ | Midwest | 14 |
| 57 | San Antonio, TX | C+ | South | 28 |
| 58 | Little Rock, AR | C+ | South | 29 |
| 59 | Augusta, GA | C+ | South | 30 |
| 60 | Tampa, FL | C+ | South | 31 |
| 61 | Atlanta, GA | C+ | South | 32 |
| 62 | Springfield, MO | C+ | Midwest | 15 |
| 63 | Youngstown, OH | C+ | Midwest | 16 |
| 64 | Providence, RI | C+ | Northeast | 10 |
| 65 | Richmond, VA | C | South | 33 |
| 66 | Lancaster, PA | C | Northeast | 11 |
| 67 | Reno-Sparks, NV | C | West | 7 |
| 68 | Shreveport, LA | C | South | 34 |
| 69 | San Jose, CA | C | West | 8 |
| 70 | Fort Wayne, IN | C | Midwest | 17 |
| 71 | Detroit, MI | C | Midwest | 18 |
| 72 | Orlando, FL | C | South | 35 |
| 73 | Charleston, SC | C | South | 36 |
| 74 | Bakersfield, CA | C | West | 9 |
| 75 | Phoenix, AZ | C | West | 10 |
| 76 | Chicago, IL | C- | Midwest | 19 |
| 77 | San Francisco, CA | C- | West | 11 |
| 78 | Columbia, SC | C- | South | 37 |
| 79 | Sacramento, CA | C- | West | 12 |
| 80 | Salt Lake City, UT | C- | West | 13 |
| 81 | Fayetteville, NC | C- | South | 38 |
| 82 | Portland, OR | C- | West | 14 |
| 83 | Rio Rancho, NM | C- | West | 15 |
| 84 | Philadelphia, PA | C- | Northeast | 12 |
| 85 | Jackson, MS | D+ | South | 39 |
| 86 | Sarasota, FL | D+ | South | 40 |
| 87 | El Paso, TX | D+ | South | 41 |
| 88 | Riverside, CA | D+ | West | 16 |
| 89 | Las Vegas, NV | D+ | West | 17 |
| 90 | Tucson, AZ | D+ | West | 18 |
| 91 | Mobile, AL | D+ | South | 42 |
| 92 | Cape Coral, FL | D | South | 43 |
| 93 | McAllen, TX | D | South | 44 |
| 94 | Eugene, OR | D | West | 19 |
| 95 | New York, NY | D | Northeast | 13 |
| 96 | Fresno, CA | D | West | 20 |
| 97 | San Diego, CA | D | West | 21 |
| 98 | Miami, FL | D- | South | 45 |
| 99 | Los Angeles, CA | D- | West | 22 |
| 100 | Honolulu, HI | F | West | 23 |
Homebuyer performed a sizable amount of original research in our search for the Best U.S. Cities For Young Adults.
This is an objective analysis based on statistical studies and credible resources. The only component of our study that can be considered “opinion” is our opinion that Young Adults should be able to afford the city in which they live—especially if they are making the move out of their parents’ house.
We would say that about any age group.
Affordability matters to everyone. When your life is affordable, you give yourself options. You can use your excess money to buy a home with a low down payment (or a big one), set aside money for retirement, and protect your loved ones with a proper life insurance policy.
Including affordability, we identified six categories that matter to people of all ages and assigned a relative weight to each.
Then, using government and private sources, we logged local data for more than 3,500 cities — from Abbeville, Louisiana to Zuni Pueblo, New Mexico — before narrowing our data set down to the 100 most populous cities for people aged 20-34, where entry-level jobs are ample.
We ranked these “Best Places for Young Adults to Live” from A to F. The six categorical rankings are as follows.
Your salary is not your paycheck. Your salary is what you earn. Your paycheck is what you take home after taxes and fees.
Depending on where you live, your paycheck can be shrunk. Many cities levy taxes on people working within city limits to pay for public services such as parks and sanitation.
Tax rates can be as high as six percent, or $6 from your paycheck for every $100 you earn.
Furthermore, the value of your paycheck varies based on where you live.
In some cities, renting an apartment, shopping for food, and buying clothes costs more than the national average. Your paycheck gets used up faster. There’s less left over to spend on things such as leisure, fun, and savings.
We wanted to capture this dynamic as part of our “Best Places To Live” study for Young Adults because it’s a real-world event that’s rarely discussed. Your salary may not be as important as you think.
We did an abundance of research related to each city’s entry-level salary range, taxes charged to workers by the city and state, and the city’s specific cost of living to find what a dollar earned in each city is actually worth. We sourced income data from the Census Bureau’s American Community Survey, referencing workers twenty-five years or older with a Bachelor’s Degree; cost of living data from the government’s Cost of Living Index as published in the Statistical Abstract of the United States; and, tax data from each state’s Department of Revenue and each city’s City Office.
Multiple cost-of-living indices are available through the Statistical Abstract of the United States. We chose the index that factors the cost of grocery items, housing, utilities, transportation, healthcare, and miscellaneous goods and services into its result.
We ignored the cost of renters insurance because it’s property-specific and linked to additional coverages, including personal liability and auto insurance, which can be bundled for discounts and savings. We computed the median earnings for each city, adjusted for state and local taxes, and then normalized that figure for the city’s cost of living.
This allowed us to rank every U.S. city by its relative income-earning potential. Cities in which workers keep more of their paycheck received the highest scores.
There’s a positive correlation between the number of restaurants, bars, and clubs in a city and its vibrancy.
When you want to go out — after work or on the weekend — you want to have options. A city’s food and social scene matters to Young Adults looking for the best places to live. Using data from the Economic Census of the United States, we found the number of food and drink establishments in a city and adjusted it against that city’s total population aged 20-34 to find the number of restaurants, food trucks, coffee shops, bars, clubs, brunch spots, and other venues per person.
Cities with more places to eat and drink per young person received higher scores than cities with fewer places to eat and drink.
Owning a car can add a lot to your monthly expenses.
First, there’s the cost of the car. Whether you choose to lease or buy your car, that monthly payment comes due each month, along with the cost of parking. In some cities, there’s an abundance of street parking available at all times.
More commonly, you pay to park your car at home, work, or both. Those costs can add up. You’ve also got the cost of gas; and car insurance (by the way, you should probably shop for cheaper car insurance).
For all of these reasons, we considered the strength of each city’s public transportation system when making our list of “Top U.S. Cities For Young Adults and Professionals.”
Using data from the U.S. Census Bureau’s American Community Survey, we gathered data on the number of workers aged 20-44 who walk or take public transportation to work, including trains, subways, buses, and ferries.
Cabs and on-demand drivers like Uber and Lyft are not considered public transportation.
Cities with a higher percentage of workers who walk or who take public transportation to work were awarded higher scores.
When you’re moving to a new city and making a new life, it’s important to find your tribe; people with common interests to you and with whom you can form relationships.
This is why we researched the population density of young people in U.S. cities as part of the “Best Cities for Young Adults and Professionals” study.
To find the population density of people in their twenties, we used the Census Bureau’s American Community Survey to find the total population of people aged 20-29 within each of the country’s urban areas, then compared that figure against the total number of people living in the same urban area.
The higher a city’s ratio of young people to its overall population, the higher it scored in our system.
When you’re moving to a new city as a Young Professional, you’ll want to ensure you get the job you want. So, an abundance of entry-level jobs in the city is important.
To determine the number of full-time, entry-level job openings by city, we searched the Indeed.com database and set a 25-mile radius around each city center, assuming that Young Adults and Professionals will commute up to twenty-five miles for an entry-level job.
After finding the number of available entry-level positions in a city, we adjusted it against U.S. Census Bureau data showing the city’s population aged 20-34, which shows the relative strength of the entry-level job market for Young Adults.
As human beings, time is our most valuable asset. How we spend it shapes who we are and what we can accomplish, so we included “time spent commuting” as part of the Best Cities For Young Adults and Professionals study.
The less time you spend commuting, the more time you have for interests and hobbies such as sports leagues, gaming, and hitting the gym.
Using data from the American Community Survey published by the U.S. Census Bureau, we found the typical travel time to work for workers over 16 years of age across the country who do not work from home.
Data was split into 5-minute increments up to the forty-five minute mark, at which point larger increments were used. Each city was then assigned a score based on the minutes it takes to commute to work.
Cities with lower commuting times were awarded higher point totals.
`
Homebuyer conducted its research to help Young Adults and Professionals make better decisions about their money, careers, and lives.
If you’ve found our research helpful, you can share this article online with proper attribution.
Here’s how to properly share this study:
For follow-up information and usage rights for our research, please email hello@homebuyer.com. We’re happy to help you do more with our data.
This article, "100 Best Cities For Young Adults and Professionals," authored by Dan Green, is based on extensive professional mortgage experience and includes references to trusted sources such as industry-leading financial institutions and expert research from the following websites:
This article was last updated on December 12, 2024.
Wave goodbye to waiting times and say hello to our faster, better mortgage application. It's available anytime you are, 24/7/365. The power to approve your mortgage is just a click away.

A Division of Ixonia Bank
Member FDIC. Equal Housing Lender.
Homebuyer.com
Operated by Novus Home Mortgage,
A Division of Ixonia Bank
1311 Vine St
First Floor
Cincinnati, OH 45202
513-824-8171
Notices
Mortgages
Notifications